
Panels and Reports
Introduction
CheckOP’s Dashboards and Reports module allows you to view the status of operations through indicators, graphs, and exportable reports. Its purpose is to centralize the information generated by executed tasks to facilitate operation monitoring, results analysis, and decision-making.
This module compiles the information captured during the execution of tasks, forms, and processes, presenting it in graphical or tabular form according to the user’s needs.
How Does It Work?
Dashboards: These allow you to view key operational indicators through charts and cards displaying real-time metrics.
Reports: Allow you to view detailed information from the system, apply filters, and export results for external analysis.
The information displayed depends on the user’s permissions and the selected filters.
Flexibility
- Dashboards can display information from one or more processes.
- Filters allow you to analyze only the required information.
- Reports can be exported for analysis or audits.
- Metrics are automatically updated as new tasks are executed
Access the Dashboard
Process
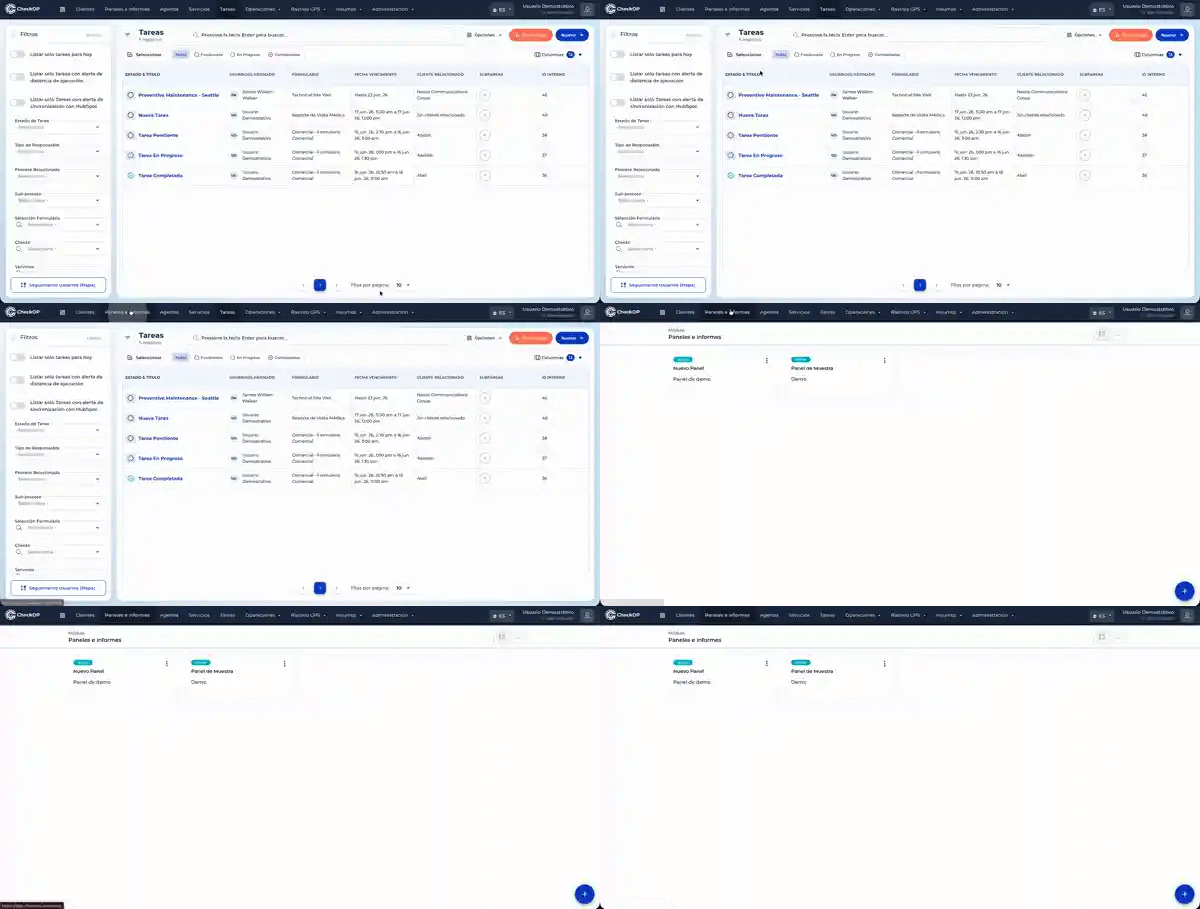
- Go to the Panels and Reports module.
- Select the Dashboards tab.
- The main dashboard will be displayed, showing the available metrics.
View Metrics
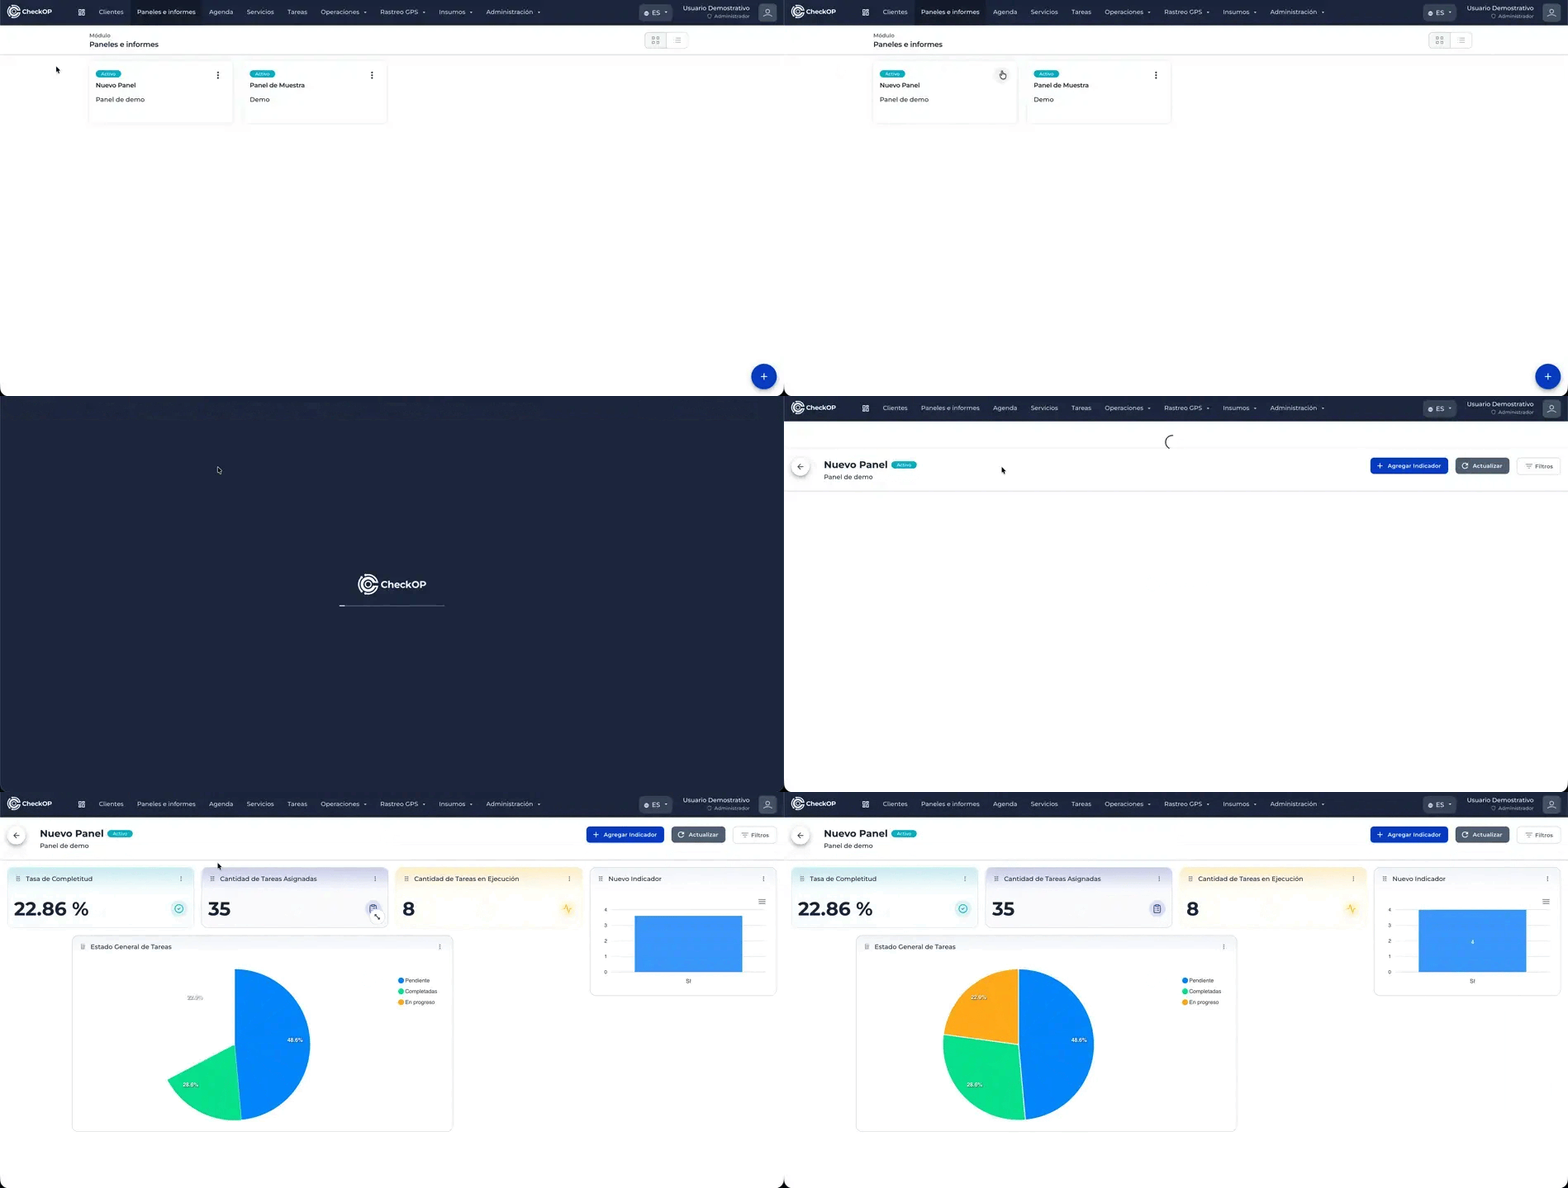
Each chart can represent information in different ways depending on the type of data.
Examples
- Bar charts.
- Pie charts.
- Time series.
- Dashboards.
- Summary tables.
This allows for a quick analysis of the operation’s performance.
Considerations
- The information displayed depends on the permissions assigned to the user.
- The metrics reflect information recorded in real time.
- Reports can be filtered to facilitate analysis.
- Custom PDF reports are an additional feature that requires specific configuration.
- Advanced analytical dashboards may vary depending on the version and features enabled in the account.
Filter Information
The dashboards and reports allow you to apply filters to view only the information you need.
Available filters
- Date range.
- Processes.
- Subprocesses.
- Users.
- Work teams.
- Clients.
- Task status.
- Services or products.
When you apply or modify a filter, the information is automatically updated to show only the records that meet the selected criteria.
Create Panel
Process
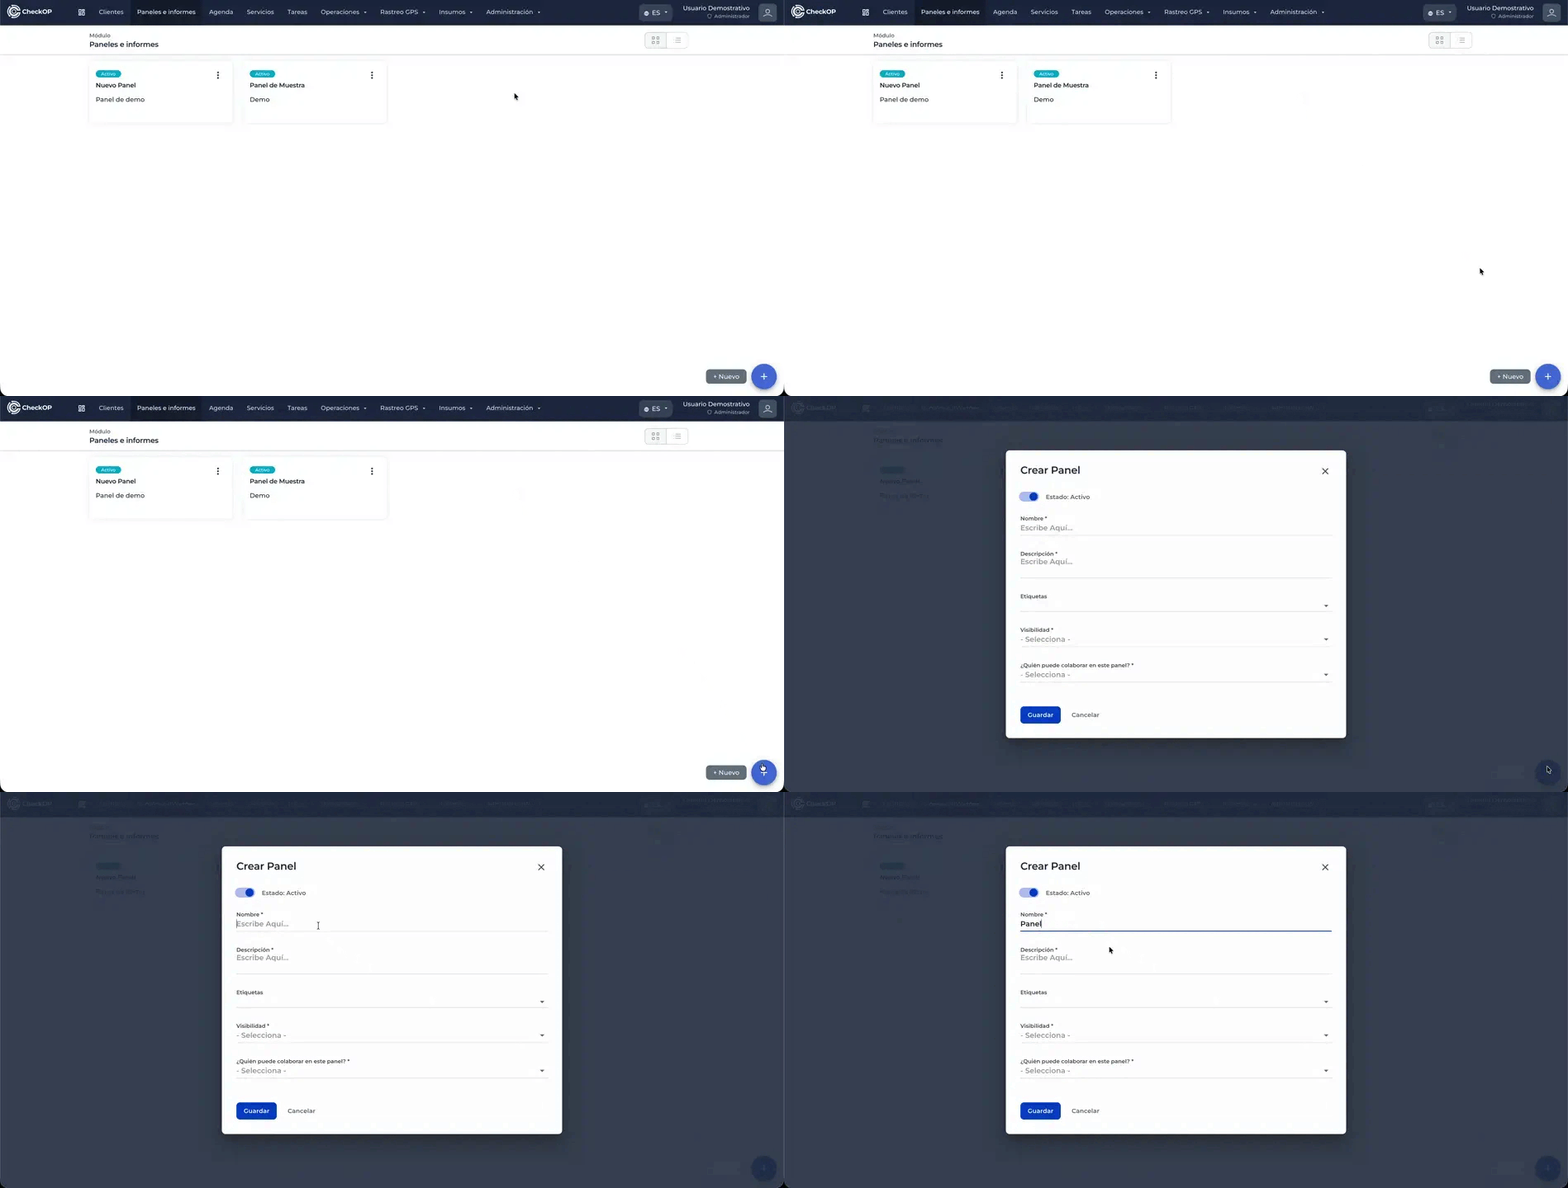
- Go to the Panels and Reports module.
- Select the Dashboards tab.
- Click New Dashboard.
- Enter a name that identifies the dashboard.
- Add a description to make it easier to identify.
- Add collaboration and viewing permissions
- Save the record.
Once created, the dashboard will be available for adding metrics and customizing the information it displays.
Create Metrics
Create a Standard Indicator
Standard metrics use information automatically generated by CheckOP during the execution of the operation. They do not require additional forms or configurations, as they retrieve data directly from the platform.
This type of indicator is ideal for displaying general metrics such as task status, user productivity, and other operational indicators.
Process
- Go to the Dashboards and Reports module.
- Open the dashboard where you want to add the indicator.
- Select the Add Metric option.
- Select the Standard type.
- Select the metric you want to display.
- Save the settings.

The widget will immediately appear in the panel and begin displaying the available information.
Standard Indicators Available
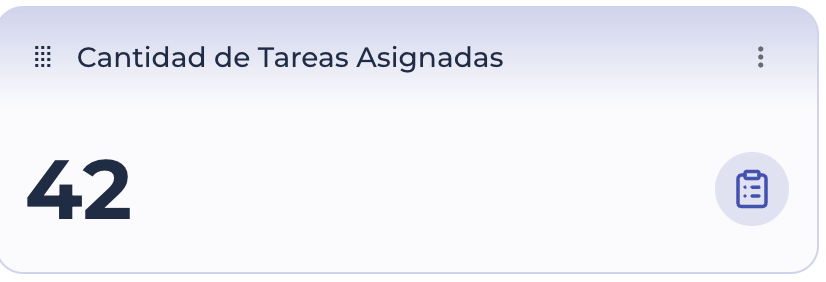
Number of Assigned Tasks
The "Number of Assigned Tasks " metric shows the total number of tasks that have been assigned to users during the selected period.
This metric provides insight into the planned workload and allows you to monitor the organization’s operational load.
The information displayed is automatically updated as new tasks are created or filters are applied to the dashboard.
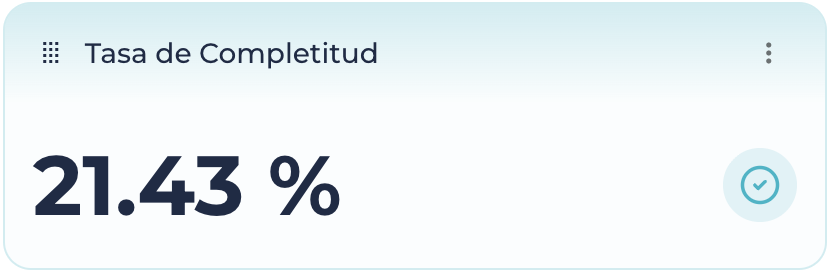
Completion Rate

The Completion Rate represents the percentage of tasks that have been completed out of the total number of tasks assigned during the period in question.
This metric makes it easier to measure the operation’s level of compliance and allows for an evaluation of the overall performance of work teams.
Its value is automatically updated as tasks change to the " Completed" status.
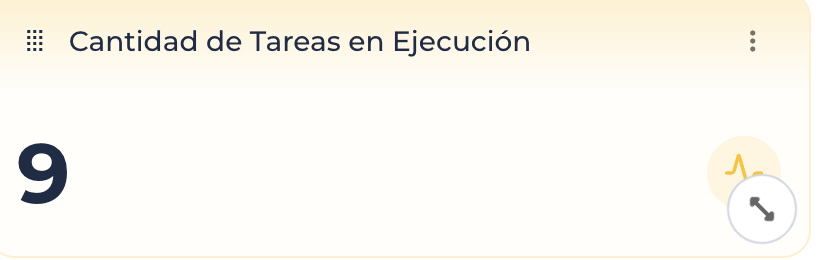
Number of Tasks in Progress
The "Number of Tasks in Progress " indicator shows the number of tasks that are currently in the " In Progress" status.
It is especially useful for monitoring operations in real time and determining how many activities users are performing at any given moment.
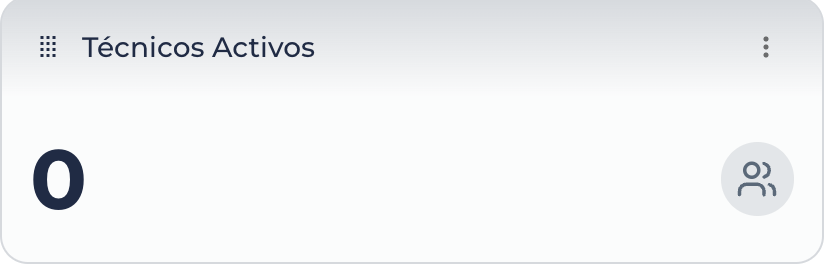
Active Technicians
The " Active Technicians " metric shows the number of users who were active during the selected time period.
This indicator shows how many technicians or team members participated in performing tasks and makes it easier to monitor the team’s operational availability.
Overall Status of Tasks
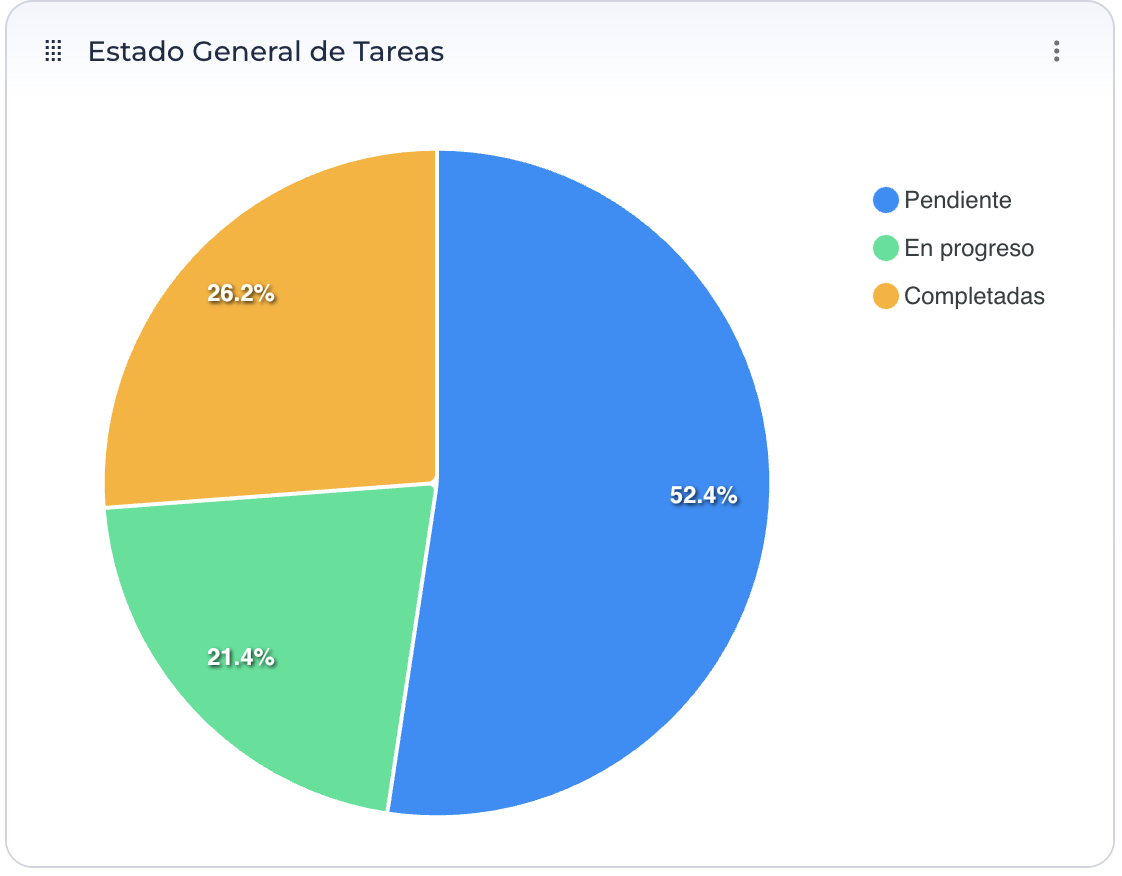
The Overall Task Status indicator displays a pie chart showing the distribution of tasks based on their current status.
They are generally classified as:
- Pending.
- In Progress.
- Completed.
This chart allows you to quickly identify the overall status of the operation and the proportion of tasks at each stage of the process.
Workload and Performance by Technician
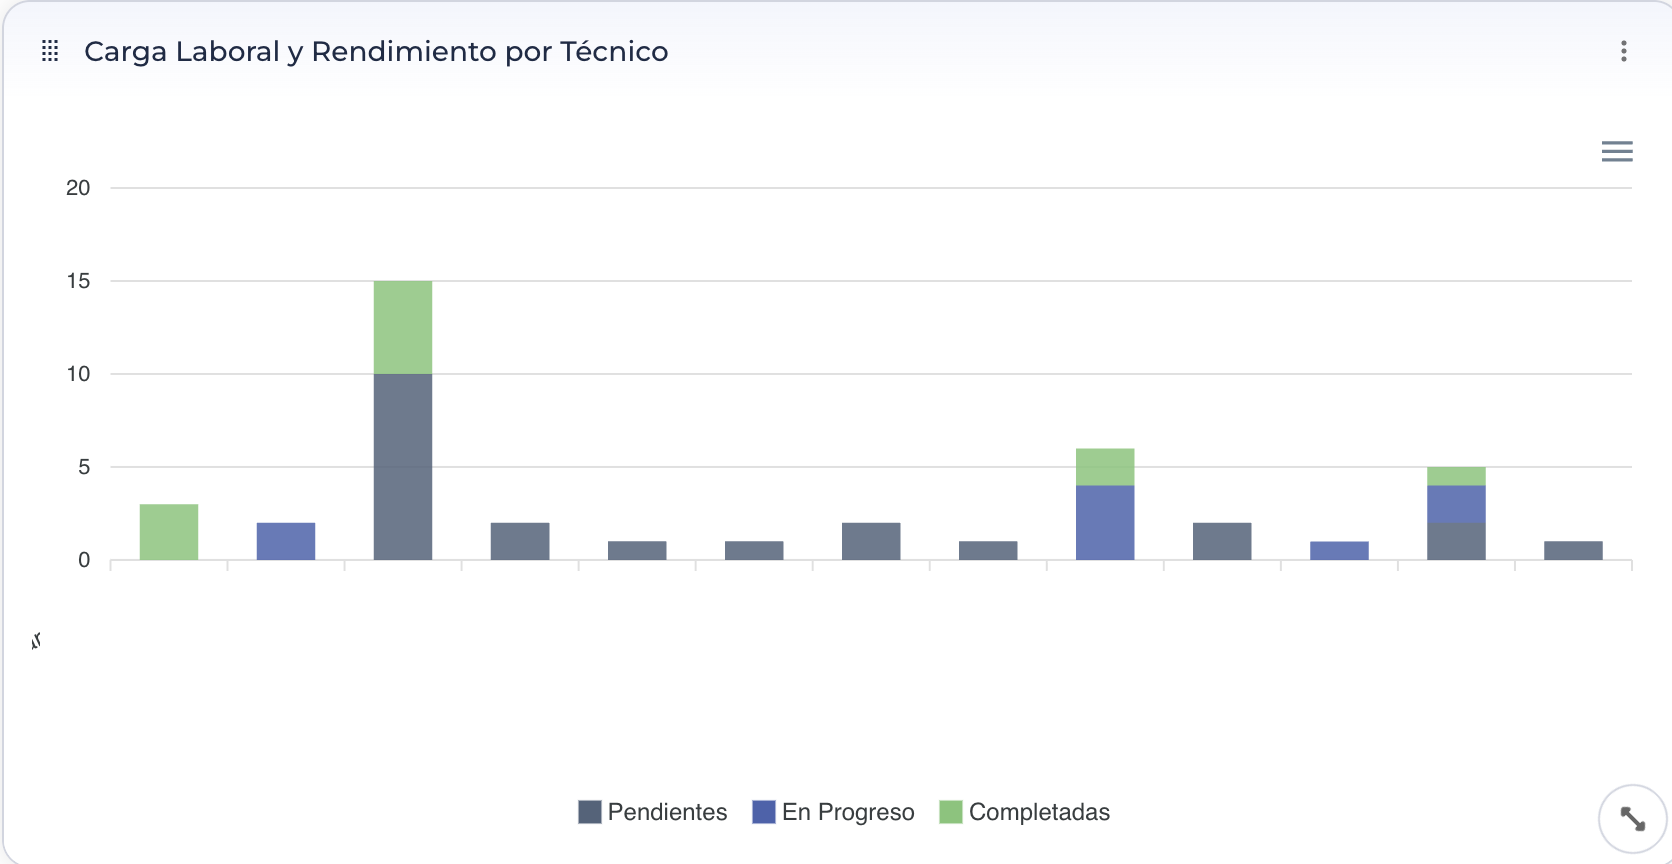
The "Workload and Performance per Technician " metric compares the number of tasks assigned to and completed by each user.
Its purpose is to facilitate the analysis of work distribution and evaluate the individual performance of each technician during the selected period.
This indicator helps identify imbalances in task assignment and opportunities for improvement in operations.
Breakdown by Main Process
The " Distribution by Main Process " indicator shows how tasks are distributed among the different processes configured in CheckOP.
It allows you to identify which processes account for the largest number of activities and analyze operational performance by each main process.
Monthly Productivity Trend
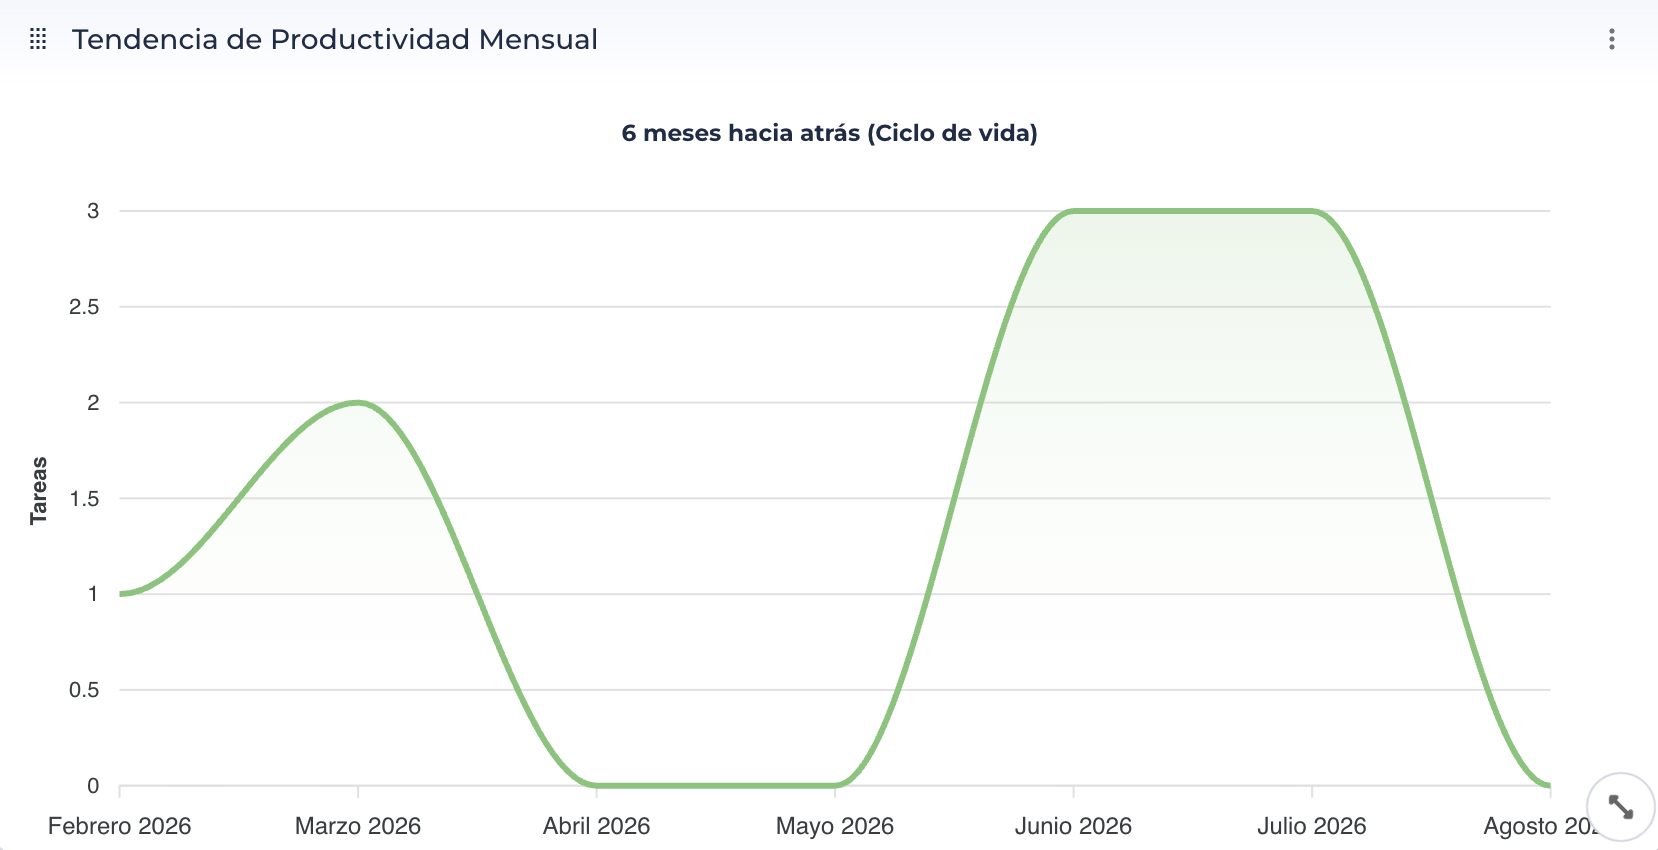
The Monthly Productivity Trend indicator shows the trend in the number of tasks completed each month.
This chart allows you to identify increases or decreases in productivity and analyze the operation’s performance over time.
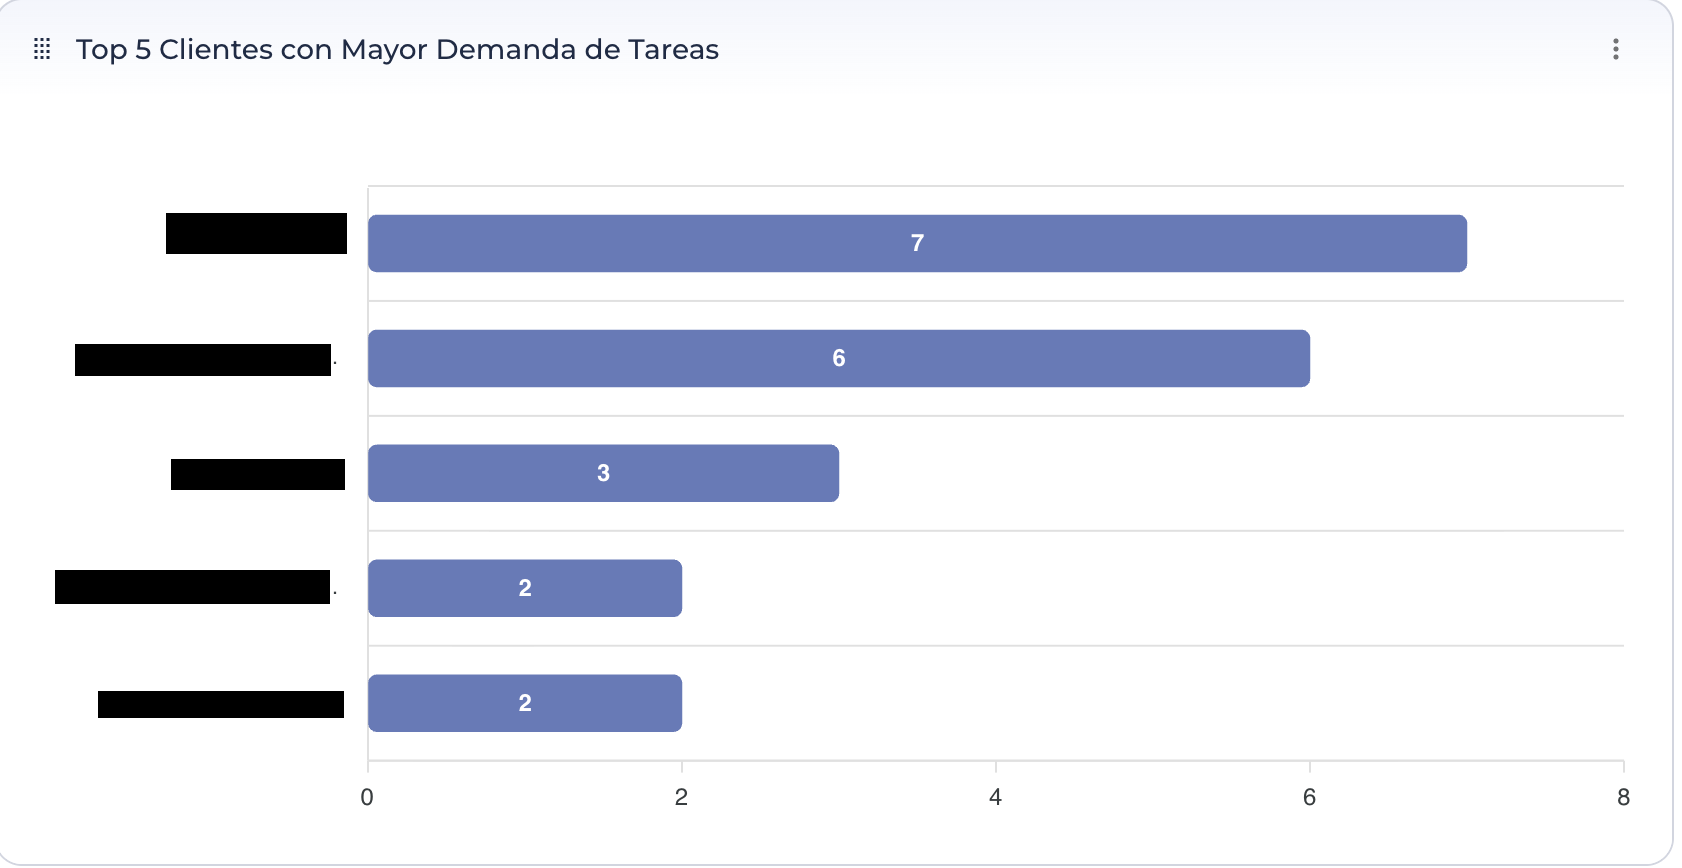
Top 5 Clients with the Highest Demand for Tasks
This metric shows the five customers with the highest number of tasks during the selected time period.
Its purpose is to identify the clients with the highest operational demand, facilitating workload analysis and resource planning.
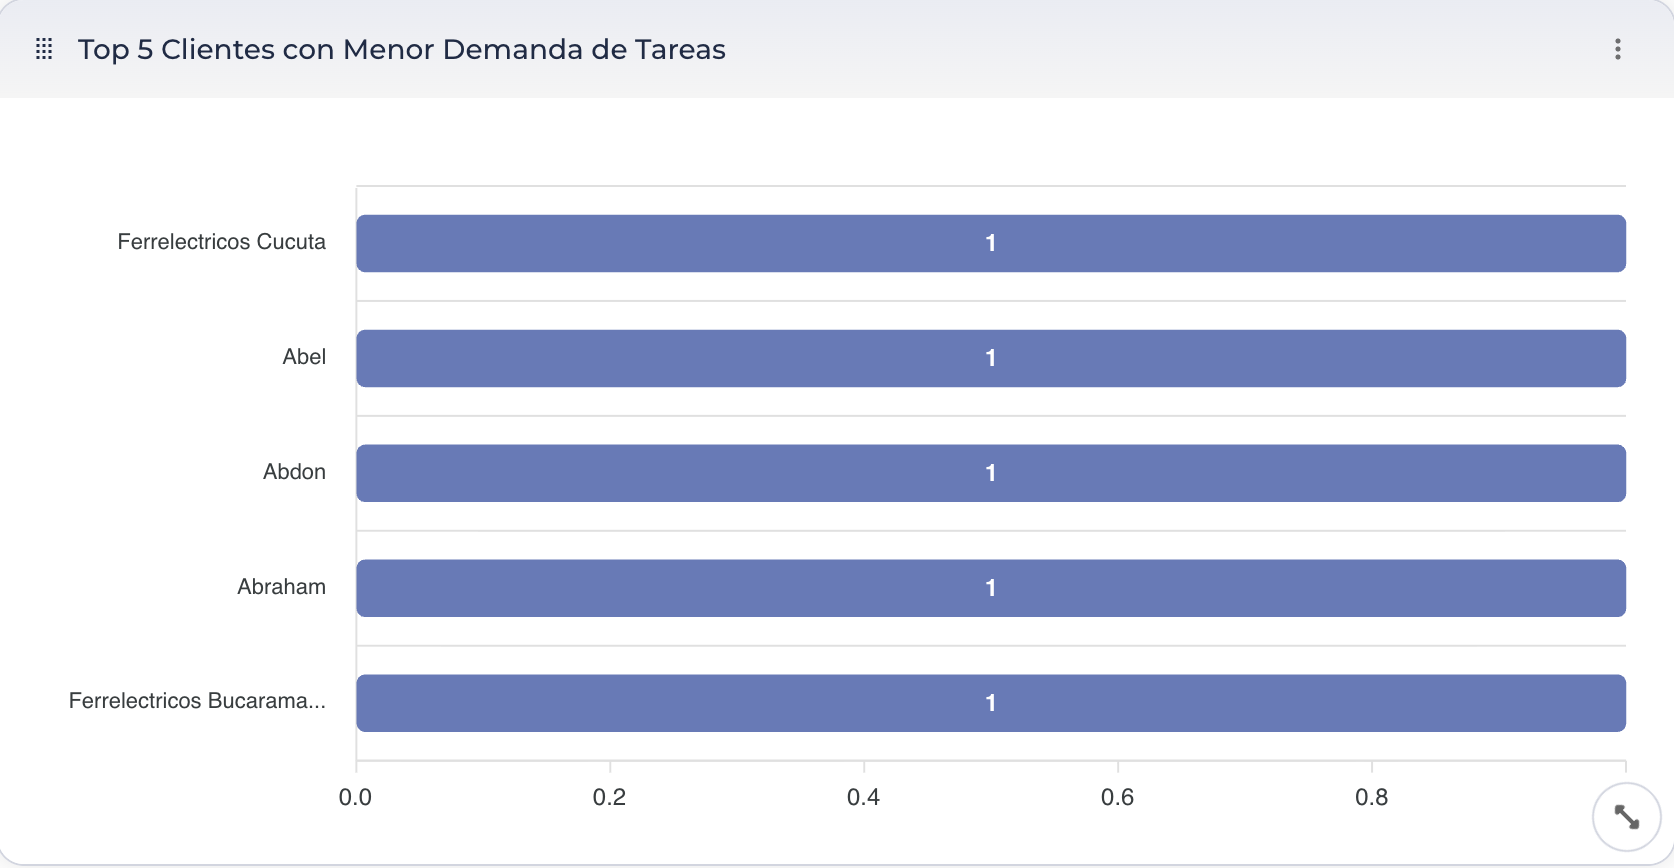
Top 5 Clients with the Lowest Demand for Tasks
The "Top 5 Clients with the Lowest Task Demand" metric shows the five clients with the lowest number of tasks recorded during the selected period.
This information can be used to identify clients with low activity or to analyze the distribution of services provided.
On-Time Delivery (SLA)
The Service Level Agreement (SLA) Compliance metric measures the percentage of tasks completed within the established timeframe compared to those that exceeded the defined deadline.
This indicator allows us to evaluate compliance with service level agreements (SLAs) and track operational performance in terms of committed timelines.
.png?width=1682&height=872&name=Paneles-Cumplimiento%20de%20Plazos%20(SLA).png "Panels—Service Level Agreements (SLA)")
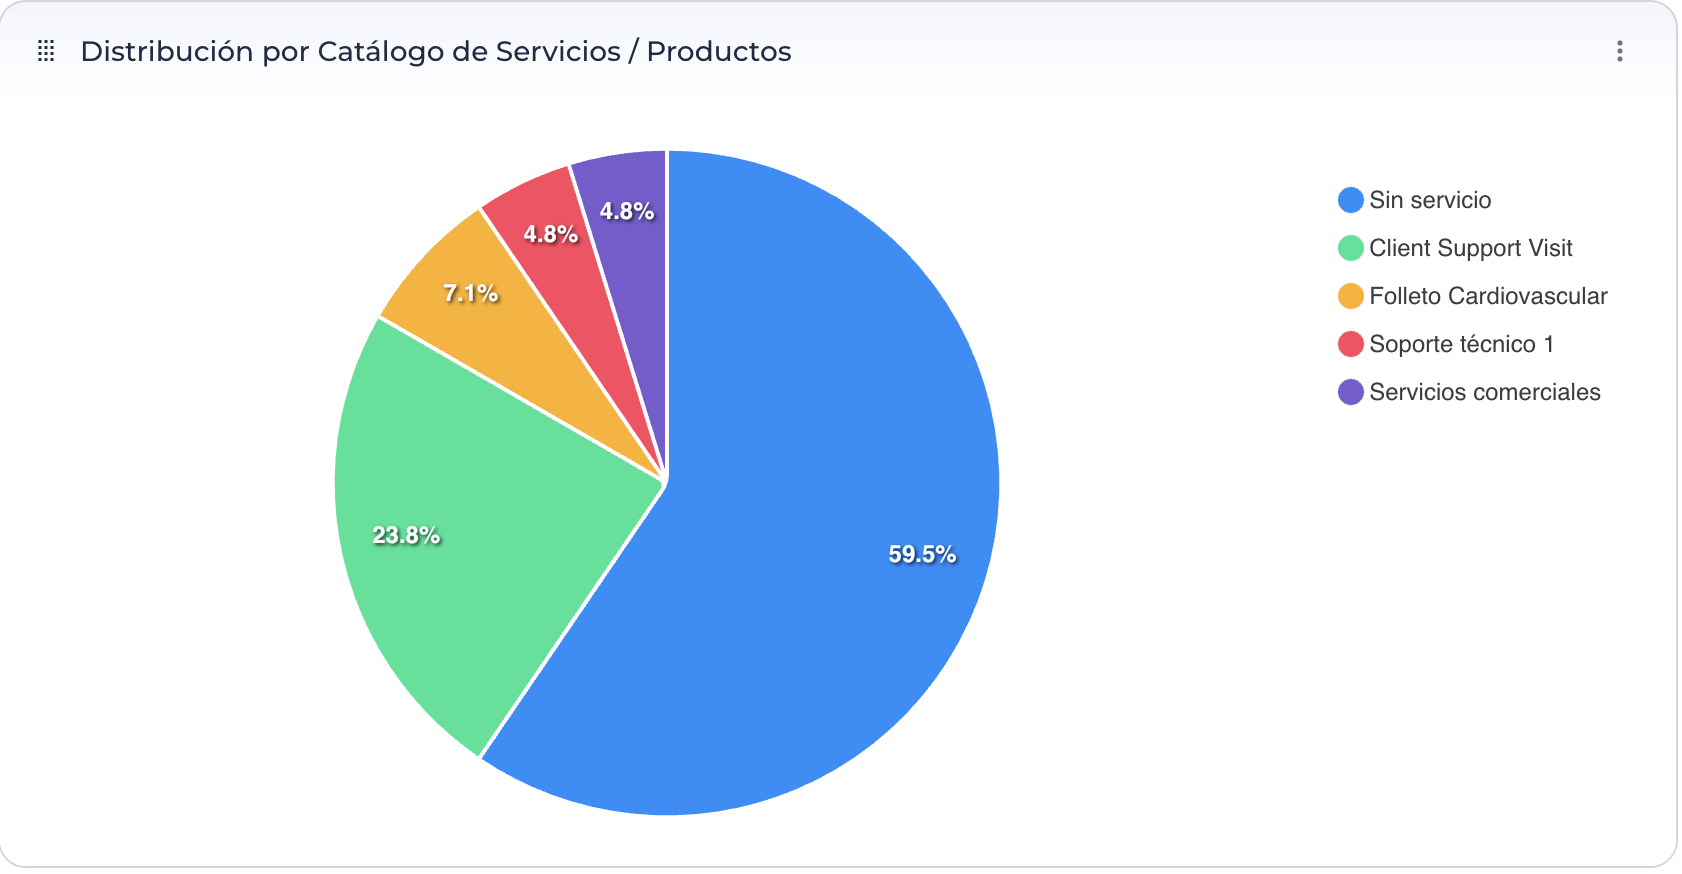
Breakdown by Service/Product Catalog
The "Distribution by Service/Product Catalog" metric shows how tasks are distributed among the different services or products configured on the platform.
This information facilitates the analysis of demand for each service or product and helps identify which ones account for the largest share of the operation.
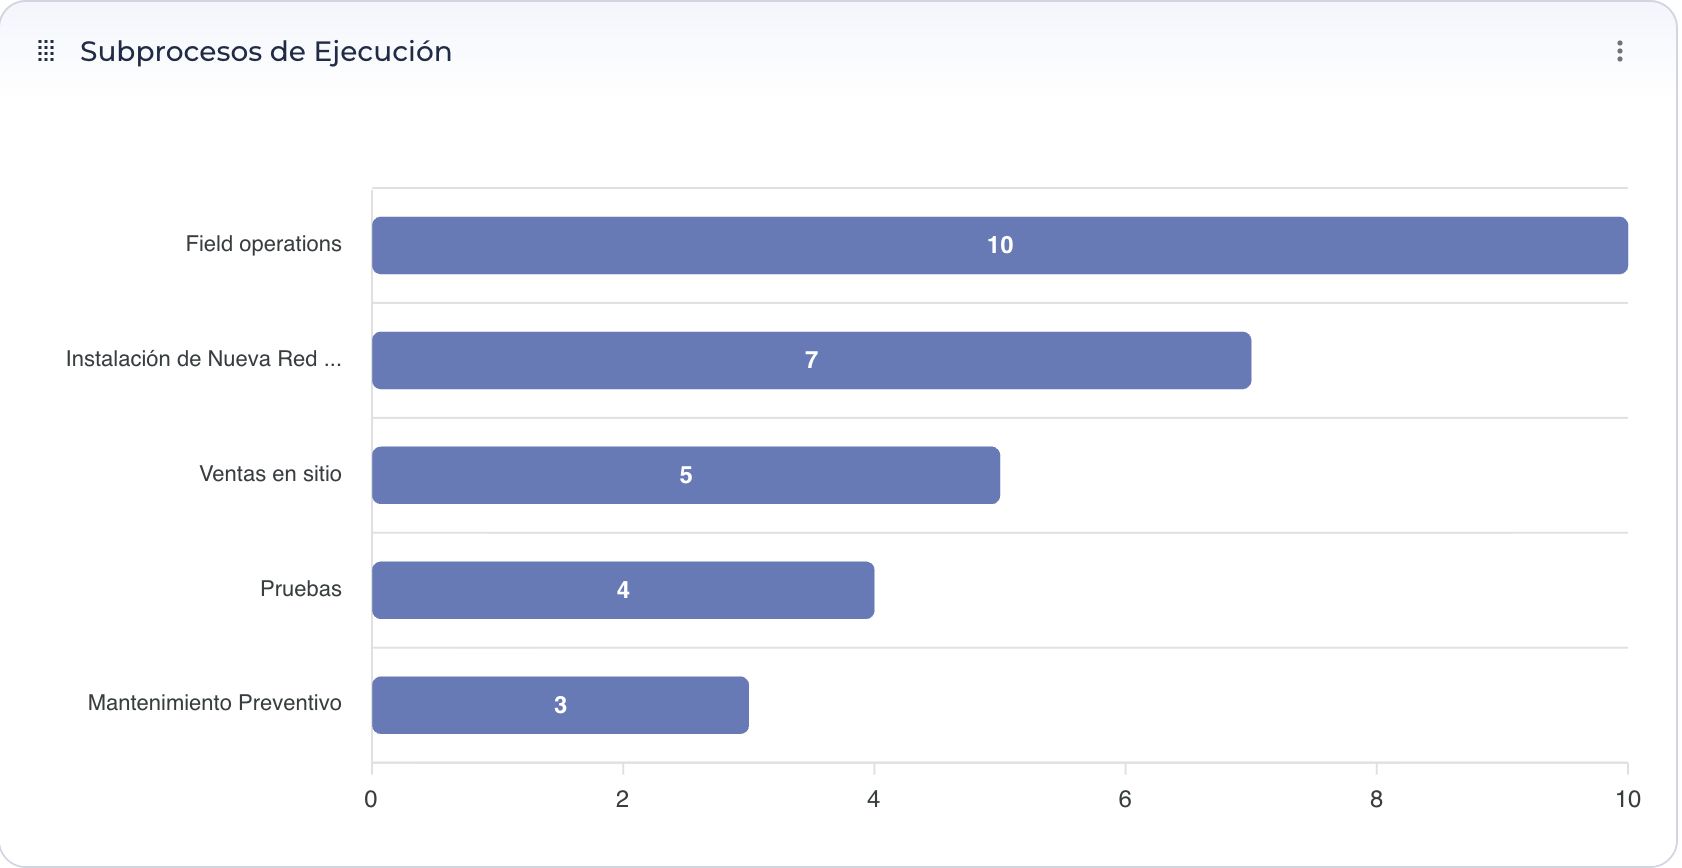
Execution Threads
The Execution Subprocesses indicator shows the distribution of tasks according to the subprocesses configured within each main process.
Its purpose is to provide a greater level of detail regarding the execution of the operation, allowing you to identify which subprocesses account for the most activity and facilitating workflow analysis.
Create a Form-Based Indicator
Form-based metrics allow you to convert responses recorded during task execution into statistical charts.
They are especially useful for analyzing business-specific information, such as reasons for visits, inspection results, satisfaction levels, or any other information captured via forms.
Important: Only questions with response types that allow for statistical grouping of information—such as Single Selection or Drop-down List—can be used.
Process
- Go to the Dashboards and Reports module.
- Open the dashboard where you want to add the metric.
- Select the Add Metric option.
- Select the Form type.
- Select the type of chart you want to use (Bar, Pie, or Line).
- Enter a name for the indicator.
- Select the form that will serve as the data source.
- Select the question that will populate the chart.
- Save the settings.
The indicator will be automatically added to the dashboard and will display the information recorded in the runs of the selected form.